A python based automated tool to validate excel sheets
This is a code sample to illustrate the capability of Python to automate working with excel sheets. Suppose, we are required to work on a set of excel files and to find some data. Normally, we will have to open each file and read the content to find the answers. This can be a tedious task, especially when the number of files are large.
Example scenarios include;
- Accounting tasks that are done daily/monthly, that are of repetitive nature
- Searching for a set of content in a group of excel files
- Validating answer sheets of an entire class and ranking them
- Applying a set of calculations to a number of similar files
We will try to implement one of these scenarios in the following code sample. This is an app to find total marks of every student in a class and then find the percentage of marks and then rank them. We are going to use openpyxl library to work on the excel files. This code covers the basic concepts like excel read, write, add rows and columns, apply style, calculations, etc.
Code is split into 2 modules, writeToExcel.py to create an excel sheet using a list of students
with marks in various subjects and findRank.py to calculate the total marks, percentage and rank.
For convenience we are keeping data in a json file. We can use any database as well.
Step by step explanation below.
-
Install Python and openpyxl
Download and install the latest version of python from Python Website.
Keep your favorite Python editor ready. This can be a basic notepad application available by default for your OS or you can download and install any free editor like VS Code.
Open command prompt and navigate to the folder where you are going to place the code and activate virtual environment.
Install openpyxl using command pip install openpyxl
Refer openpyxl basics if needed.To check if libraries installed successfully, type command pip freeze
Should give an output like:et-xmlfile==1.1.0 openpyxl==3.0.9
-
Data in Json File
Create a file named data.json and add the below content. These are the list of students which we are going to write to the excel sheet.
[ {"rollno": "101", "name": "Lisa", "maths": 95, "science": 92, "language": 97}, {"rollno": "102", "name": "Sam", "maths": 89, "science": 91, "language": 82}, {"rollno": "103", "name": "Ted", "maths": 78, "science": 85, "language": 88}, {"rollno": "104", "name": "Rob", "maths": 82, "science": 87, "language": 89}, {"rollno": "105", "name": "Peter", "maths": 98, "science": 94, "language": 100}, {"rollno": "106", "name": "Sara", "maths": 94, "science": 93, "language": 89}, {"rollno": "107", "name": "Thomas", "maths": 89, "science": 90, "language": 91}, {"rollno": "108", "name": "Kate", "maths": 92, "science": 95, "language": 88}, {"rollno": "109", "name": "Tom", "maths": 80, "science": 84, "language": 85}, {"rollno": "110", "name": "Allen", "maths": 85, "science": 85, "language": 90} ] -
Write Data to Excel
writeToExcel.py create an excel work book with a sheet named Students. Then add column headings in first row and make it bold. Final step is to read json data and append it to the sheet as rows.
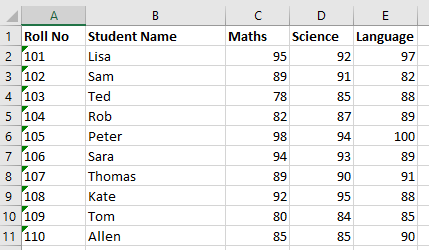
Copiedfrom openpyxl import Workbook from openpyxl.styles import Font import json import os w = Workbook() sh = w.active sh.title = 'Students' sh['A1'], sh['B1'], sh['C1'], sh['D1'], sh['E1'] = 'Roll No', 'Student Name', 'Maths', 'Science', 'Language' for hdng in sh["1:1"]: hdng.font = Font(bold=True) sh.column_dimensions[str(chr(64 + 2))].width = 20 dataFile = os.path.dirname(__file__) + '\\data.json' with open(dataFile) as d: data = json.load(d) for dt in data: sh.append([dt['rollno'], dt['name'], dt['maths'], dt['science'], dt['language']]) w.save('MarksList.xlsx')Use command python writeToExcel.py or py writeToExcel.py to run the module. If no errors, an excel sheet named MarksList.xlsx with below content will get generated.
-
Find Total Marks, Percentage and Rank
findRank.py reads the excel data and adds three more columns Total, Percentage and Rank to keep the additional data.
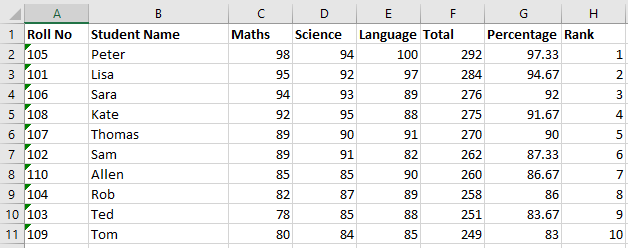
Then loop through each row and calculate total marks and percentage and update those in columns F and G. At the same time store the data in a list to apply the sorting using percentage of marks and find the rank. Then delete existing data and rewrite the new sorted data to excel again.Copiedfrom openpyxl import Workbook, load_workbook from openpyxl.styles import Font import os def sortFunc(srt): return srt['per'] w = load_workbook('MarksList.xlsx') sh = w.worksheets[0] sh['F1'], sh['G1'], sh['H1'] = 'Total', 'Percentage', 'Rank' for hdng in sh["1:1"]: hdng.font = Font(bold=True) sortList = [] for i, r in enumerate(sh.iter_rows()): if(i > 0): sh['F' + str(i + 1)] = r[2].value + r[3].value + r[4].value sh['G' + str(i + 1)] = round(r[5].value / 3, 2) sortList.append({'rno': r[0].value, 'nm': r[1].value, 'mt': r[2].value, 'sn': r[3].value, 'ln': r[4].value, 'tot': r[5].value, 'per': r[6].value}) sortList.sort(reverse = True, key = sortFunc) sh.delete_rows(2, sh.max_row+1) for rank, itm in enumerate(sortList): sh.append([itm['rno'], itm['nm'], itm['mt'], itm['sn'], itm['ln'], itm['tot'], itm['per'], rank+1]) w.save('MarksList.xlsx')On running, below excel sheet will be generated.